This project explores the effectiveness of a/b testing in optimizing website performance by utilizing a certified a/b testing dataset. I investigated the impact of different website elements like ad frequency, timing, ad spend and User engagement and compare two versions of campaign performed by the organization to determine which one performs better in terms of converting the target audience into actual customer. Implementing data analysis techniques and mathematical calculations , I was able to evaluate key metrics like Click Through Rate(CTR), Add to Cart Rate and Purchase Rate. The analysis reveals valuable insights on how data driven strategies can be used to improve website user engagement and conversion. This project highlights importance of data science and mathematics in understanding website behavior and optimizing the digital marketing strategies.
Introduction
My passion for mathematics and data science stems from their ability to unlock hidden insights and translate complex data into simple knowledge is a powerful tool especially in the evolving world of digital marketing and data driven world. For that reason, I took A/B testing project to broaden my knowledge on this field and dive deep into my interest.
A/B testing, also known as split testing, is foundation for data driven website optimization. It involves comparing two or more variations of website elements such as ad banner, landing page design and understanding how these elements play a significant role on impressions and user engagement on the site. By statistically analyzing user behavior across these variations and determine which performs the best in achieving a desired outcome.
This project delves into the practical application of A/B testing by analyzing a certified data set. My primary goal is to evaluate the impact of different website elements on user behavior. Specifically, I aim to understand how variations in landing page layout, ad frequency, timing , ad placement, influence metrics like CTR, Add-to-Cart Rate, and Purchase Rate.
By implementing data analysis techniques and mathematical calculations, I will be dissecting this data to uncover valuable insights. This exploration not only focuses on the effectiveness of the tested elements but also demonstrate the power of data science and mathematics in this data driven world.
Methodology
Data source: The dataset was sourced from Kaggle, provided by Amir Motefaker. The dataset can be accessed here.
Below are all the features in the dataset:
- Campaign Name: The name of the campaign
- Date: Date of the record
- Impressions: Number of impressions the ad crossed through the campaign.
- Reach: The number of unique impressions received in the ad
- Website Clicks: Number of website clicks received through the ads
- Searches: Number of users who performed searches on the website
- View Content: Number of users who viewed content and products on the website.
- Add to Cart: Number of users who added products to the cart
- Purchase: Number of purchases
The company performed two campaigns:
- Control Campaign
- Test Campaign
Metric Analyzed:
To gain a comprehensive understanding of user behavior, I focused on analyzing three key metrics:
o Click Through Rate(CTR)
o Add to Cart Rate
o Purchase Rate
Result & Analysis
In this section, I will be presenting the key findings extracted from the A/B testing data, analyze trends and leverage mathematical concepts to understand user behavior.
Campaign Metrics Overview
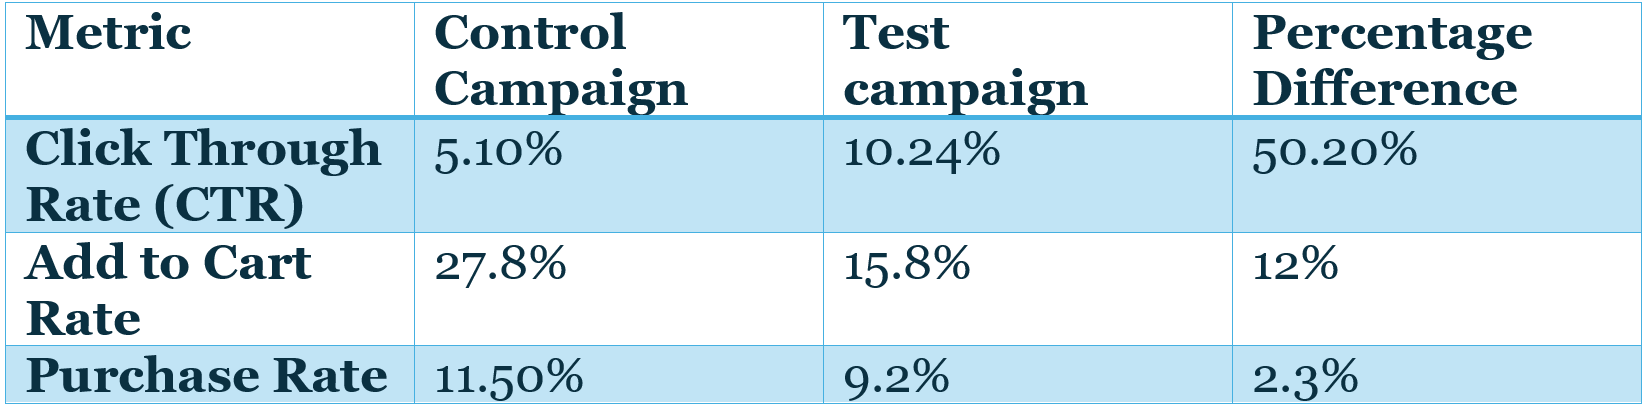
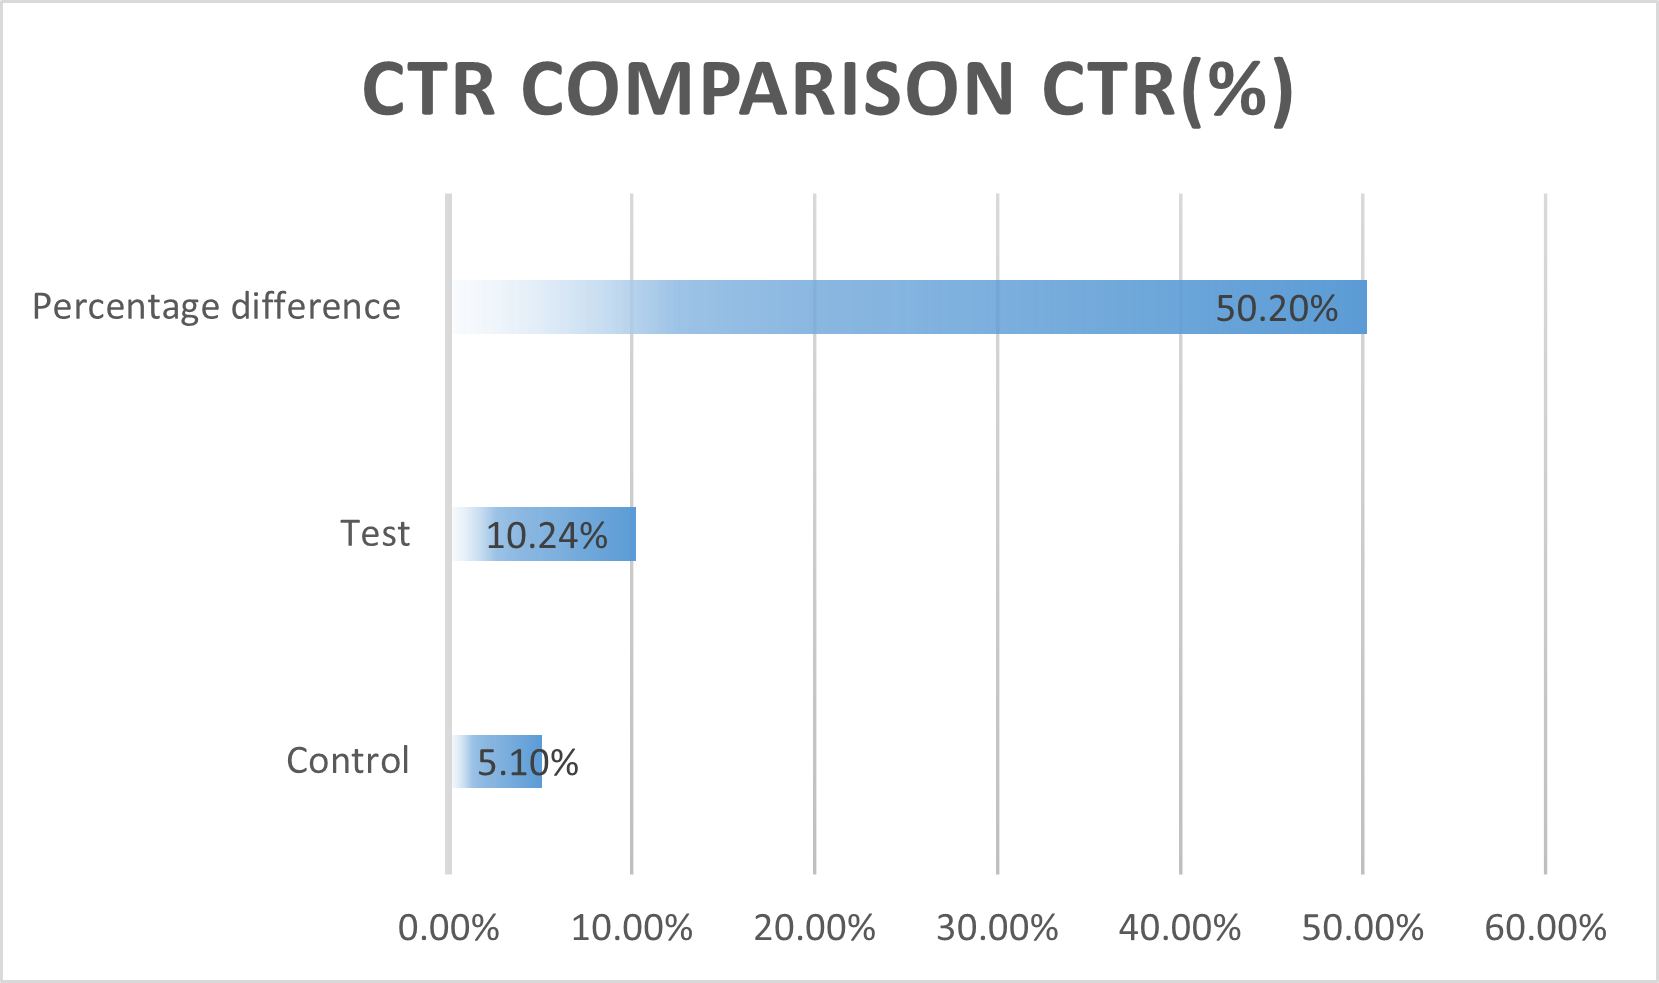
Click Through
Rate(CTR):
The Click-Through Rate (CTR) data reveals a significant difference
between the Control and Test campaigns. The Control campaign achieved a CTR of
5.10%, while the Test campaign garnered a CTR of 10.24%. This translates to a
50.20% difference in CTR.
The
test campaign element was significantly more successful in attracting user
clicks compared to the control campaign. This 50.2% increase suggests the test
element might have been more attention- grabbing or visually appealing,
promoting users to click on it at a higher rate.
However, it is crucial to consider
the entire conversion funnel.
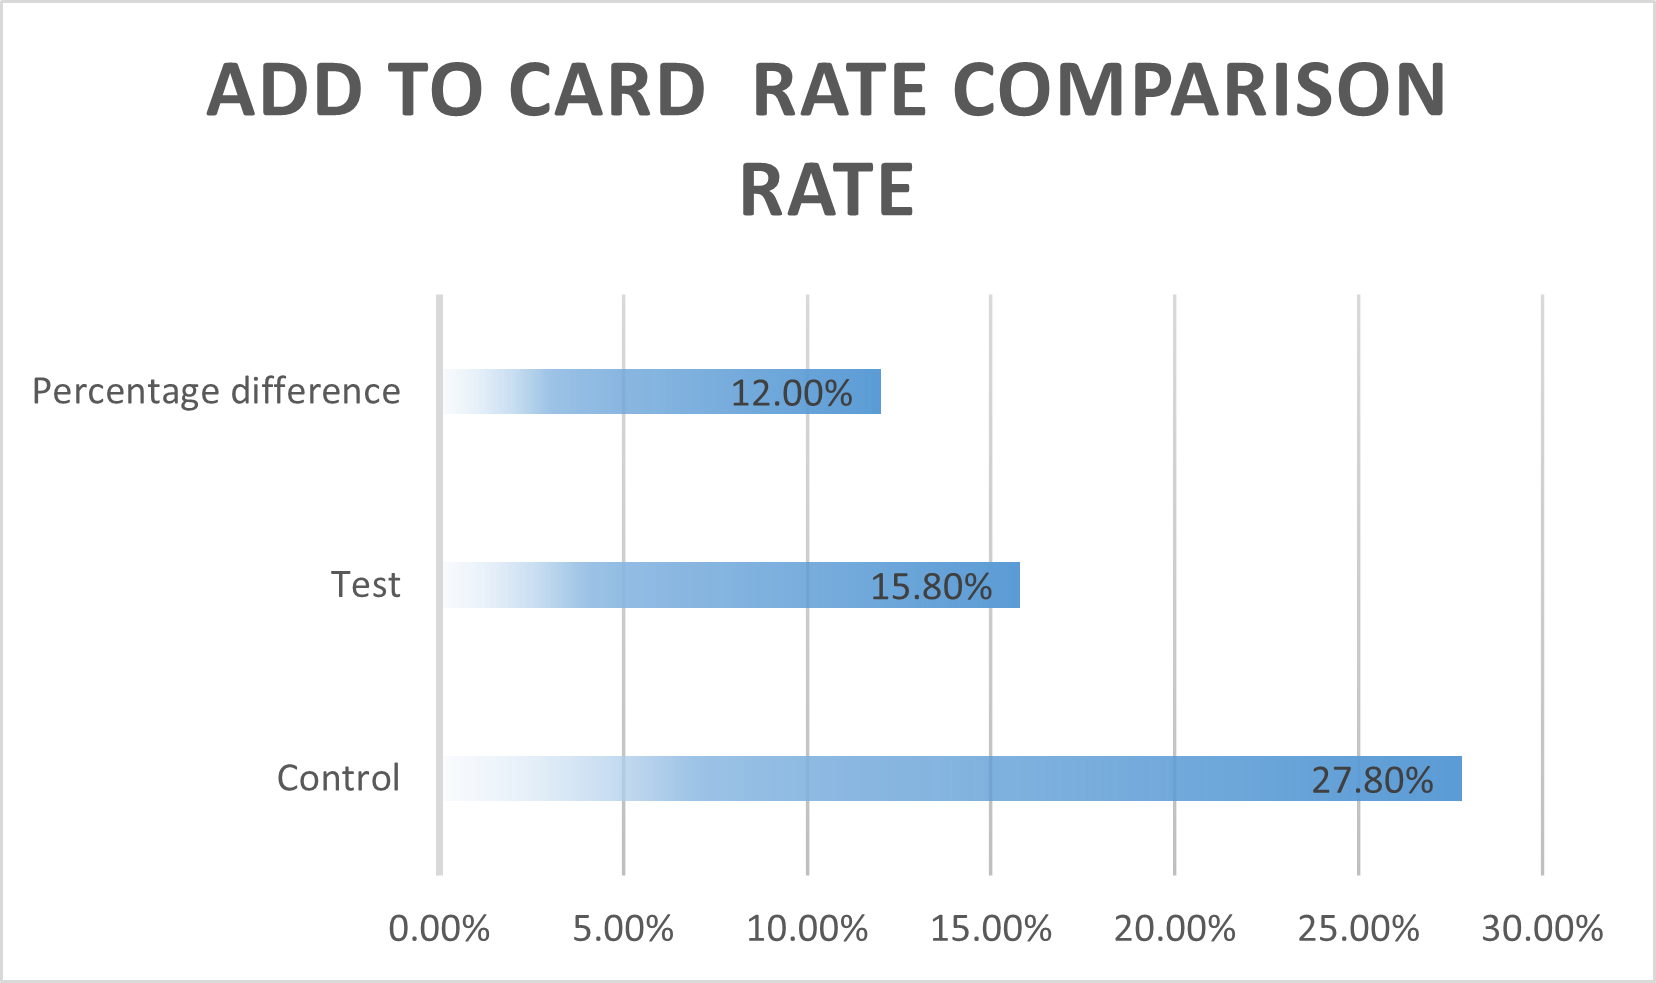
Add to Cart Rate
& Purchase Rate:
While
the test campaign achieved a higher CTR, the Add to Cart Rate and Purchase Rate data presents a different
picture. The Control campaign boasts a higher Add to Cart Rate(27.8%) compared
to the Test campaign(15.8%), resulting in a 12%
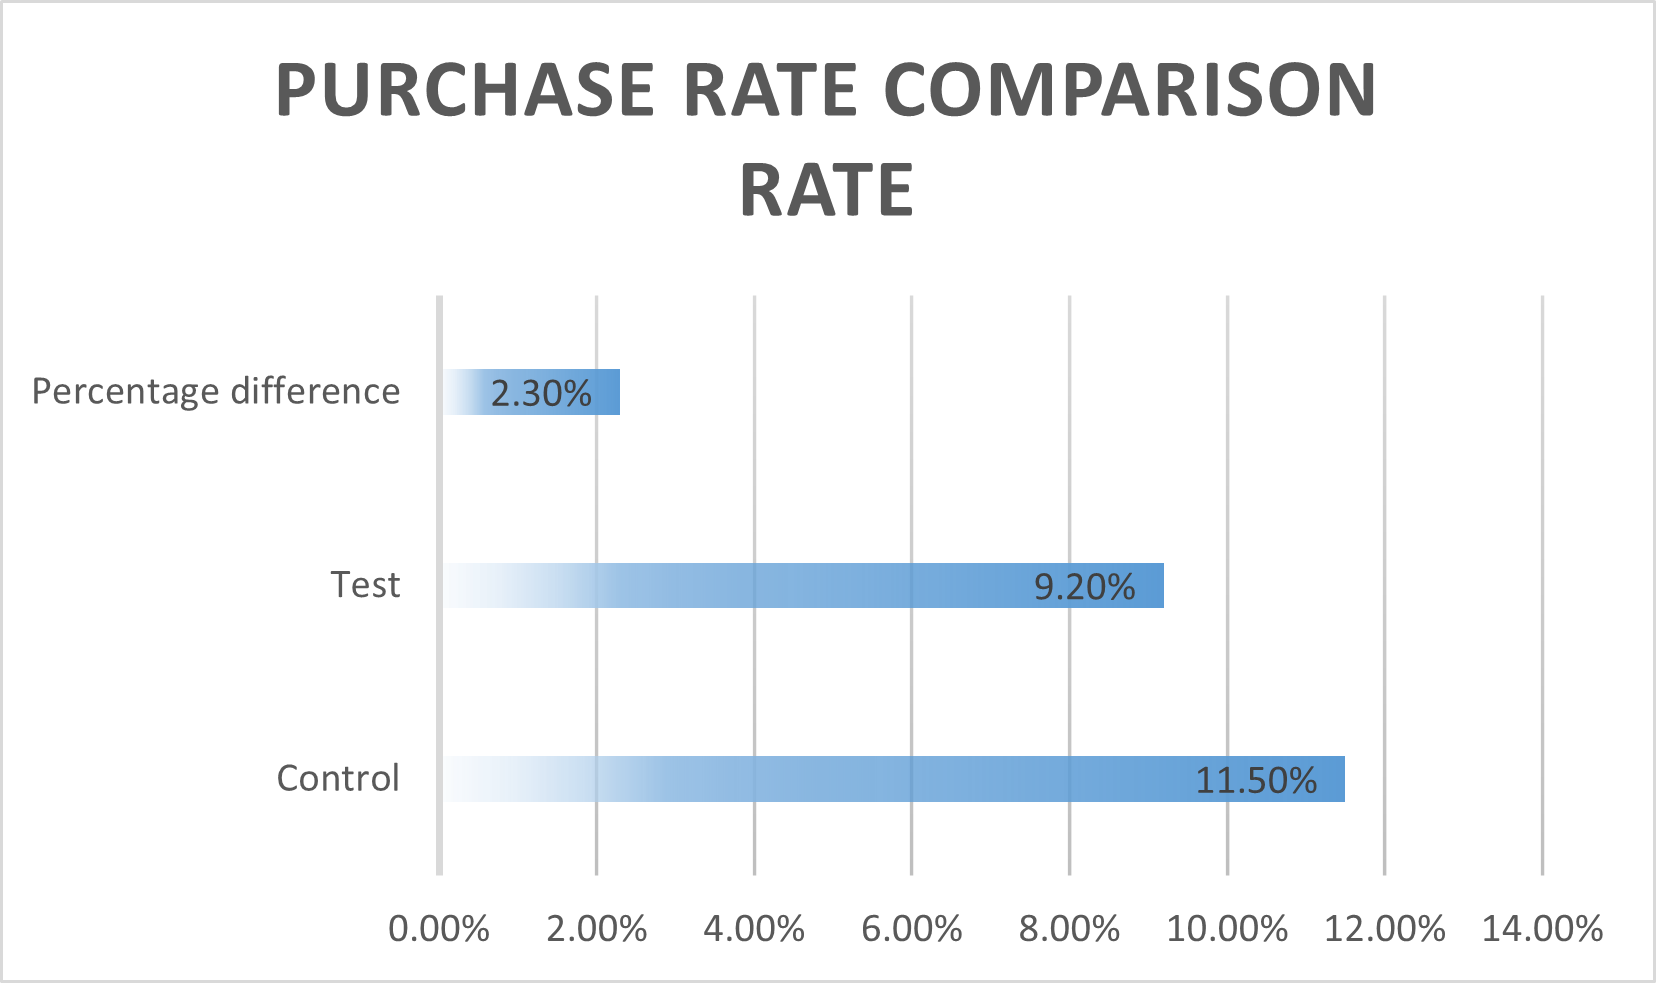
difference. Similarly,
the control campaign exhibits a higher purchase rate (11.5%) compared to the
Test campaign(9.2%) with a 2.30% difference.
The
data is visualized in the given figure:
Summary:
· The test campaign achieved a significantly higher CTR, indicating effective initial engagement.
· The Test Campaign had lower Add to Cart and Purchase Rates, suggesting issues in the later stages of conversion funnel.
Potential explanations for this trend:
Even though Test Campaign gained a significant amount of clicks, it seems users who clicked on the test element were less likely to add products to their carts or complete purchases. This could be due to several factors:
· Misalignment between ad and landing page: Although the Test ad variation might have been visually appealing but when users arrived at the landing page after clicking the ad, they might not have found the content compelling enough to convert them.
· Product/ Service mismatch: Its possible that the test ad variation attracted a broader audience that wasn’t necessarily interested in the product or service being offered.
By analyzing user behavior data beyond clicks (eg. Time spent on landing page, scroll depth) we might gain deeper insights into why users who clicked on the Test element didn’t convert at the same rate as those who clicked on the campaign element.
Discussion & Limitations
Implications of Findings:
The A/B testing results offer valuable insights for optimizing website performance. The significant increase in CTR achieved by the Test campaign element demonstrates the power of crafting visuals and messaging to caputure user attention. However, the lower Add to Cart Rat and purchase rate of the test campaign highlight the importance of a seamless user experience across the entire conversion funnel.
By applying these findings, website owner can:
· Craft more engaging ad variations:
The Test campaign’s success in attracting clicks indicates the effectiveness of the specific design or messaging used. These elements can be incorporated into future ad campaigns to attract a wider audience.
· Optimize landing pages:
Analyzing user behavior data beyond clicks can reveal areas for improvement on the Test campaign’s landing page. This may involve ensuring the landing page content aligns with the ad’s message, including clear calls to action, and refining the overall design for better user engagement.
Limitations and Future Research:
· Data Set Size:
The size and representativeness of the A/B testing data set can influence the generalizability of the findings. A larger and more diverse data set could provide more robust insights.
· Lack of Cost Data:
The absence of cost data hinders a complete cost-benefit analysis. Knowing the cost associated with each ad variation would enable a more comprehensive evaluation of their effectiveness.
Here are some potential directions for future research related to A/B testing:
· Multivariate Testing: Expanding the scope to analyze the impact of multiple website elements simultaneously can provide a more clear understanding of user behavior.
· User Segmentation: Segmenting user data based behavior patterns can lead to more targeted A/B testing strategies, potentially yielding more impactful results.
Conclusion
This A/B testing project has been a rewarding exploration into the power of data science and mathematics in optimizing website performance. By analyzing user behavior through the given data set, I was able to gain valuable insights into what resonates with user and ultimately drives impressions into customers. The limitations encountered have highlighted the importance of considering data set size, cost factors, and the potential for further exploration through advanced data analysis techniques.
Overall, this project has solidified my passion for data science and mathematics, and I’m eager to dive deeper into this fascinating field to unlock further insights from the vast world of data.
References
The data used for this report was obtained from Kaggle, a popular platform for datasets and data science projects. The dataset was posted by Amir Motefaker, a professional data analyst.
For more details on the dataset, please refer to the following link:
Motefaker, A. (n.d.). A/B Testing Dataset. Retrieved from Kaggle.